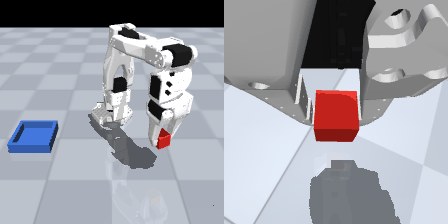
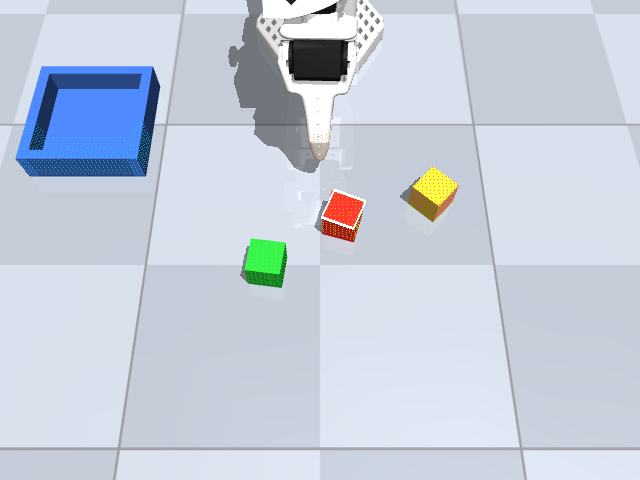
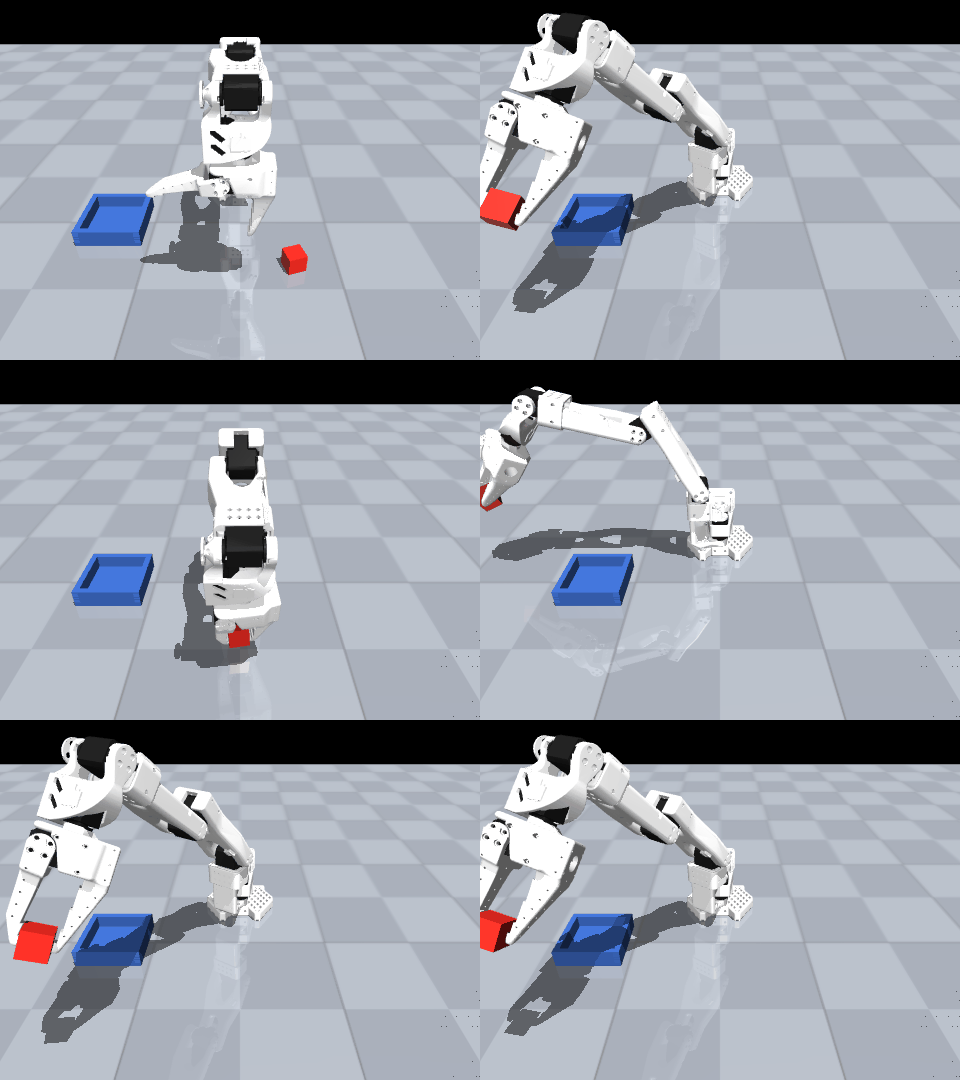
Fig. 0The cell as the simulator models it: the SO-ARM100 built from the same mesh files the simulation uses (MuJoCo Menagerie, vendored in the repositories), with the 24 mm block and the tray where the Part C scene puts them. The motion is a loop written for this page, not a recording; the recordings are in the tiles below and in each part.
A scored on the 50-attempt test, B on the 20-attempt test; each model trained once. Everything in simulation.
24 mmthe block, a cube
15 /smotor commands per second
16 slimit per attempt (240 commands)
224 × 224pixels per camera, two cameras
6joint readings: five joints + gripper
In 60 seconds
I taught one simulated robot arm the same job, pick up a block and put it in a tray, five different ways, and scored each one. Copying 150 recorded demonstrations: 90% success. Fine-tuning a pretrained robot model on 160 demonstrations: 90%. Hand-written geometry with no training at all: 20 of 20, but only for an object whose shape is programmed in. Reinforcement learning with no demonstrations: solved a simpler reach-a-point task after 8,000 practice moves, but only partly solved grasping. Rewriting the geometry's final step in C++ for ROS 2, the software real robots run on: the same results to within 0.001 mm, about three times faster. There is no single winner; the right method depends on whether you know the part's shape, can record demonstrations, or can only describe a score. I also checked the 2023 research paper the imitation model comes from, claim by claim: the claims I could test held up, except that its recommended averaging trick fails when the demonstrations show more than one way of doing the task.
The five approaches, and the conclusion
Which is the best way to teach a low-cost robot arm to pick up a block and put it in a tray? I had a simulated SO-ARM100 (a 3D-printed arm with five joints and a two-finger gripper that costs about $150 in parts, which is why hobbyists and students use it for robot-learning experiments), one job, and no idea which of the standard teaching methods was best. So I tried five of them on the same arm in the same simulated work cell (one robot station on a production line). The two methods that learn from recorded demonstrations, A and B below, got the identical task and the identical test; C, D and E each needed their own setup, and I say where they differ. The simulation ran in MuJoCo, a physics simulator: software that calculates how the arm, the block and the tray move, collide and come to rest, and draws what each camera would see.
In A and B, the model that controls the arm gets two camera images (one camera in front of the table, one on the arm's wrist) plus the arm's six joint readings (the five arm joints and how far the gripper is open), and nothing else; it is never told where the block is. A test attempt puts the block at a new random spot and counts as a success if the block ends up in the tray and the gripper pulls away within 16 seconds. Every ACT model was scored on two such tests, one of 20 attempts and one of 50; SmolVLA on the 20-attempt test only. Below, the 50-attempt figures are the headline numbers, and the 20-attempt figures appear wherever two models are compared on that test.
AImitation learning: copy recorded demonstrations. A demonstration is a recording of the task being done correctly: the two camera images, the six joint readings and the motor command (a set of six target angles, one per joint plus the gripper), 15 times a second. I recorded them with a scripted controller: a program I wrote that reads the block's true position from the simulator, which the model being trained never gets, and moves the gripper to the block along a fixed path. The model, called ACT (Action Chunking with Transformers), is trained to output the same motor commands the recordings contain when it sees the same camera images. I trained it four times, on four sets of demonstrations. Trained on 100 demonstrations recorded with the lighting, colours and physics always the same, it succeeded in 37 of 50 test attempts (74%). Trained on 150 recorded under randomly varied lighting, colours, block weight and friction, it succeeded in 45 of 50 (90%) on the same fixed-condition test. Trained on 160 demonstrations of which 20 (12.5%) deliberately miss the block on the first grab and then re-grab it, it succeeded in 31 of 50 (62%). A fourth set, 210 demonstrations with extra ones in the area where the 150-demonstration model kept failing, fixed the failures there but created new ones elsewhere (44 of 50).
BA pretrained robot "foundation model", fine-tuned. The base model was SmolVLA, a model with 450 million parameters (the adjustable numbers inside a model that training sets; more parameters means a bigger model), published by Hugging Face, the website where machine-learning models and datasets are shared. Hugging Face pretrained it on a large collection of community recordings, mostly from real arms of the same SO-100 family as mine. It takes camera images, the arm's joint readings and a text prompt (here always the sentence "Pick up the red block and place it in the blue tray") and outputs motor commands. Fine-tuning means continuing its training on my own demonstrations; I did that on a free Kaggle GPU for about 8 hours, leaving the parts of the model that read the images and the text unchanged (frozen) and adjusting only the part that outputs motor commands. Before fine-tuning it succeeded in 0 of 20 test attempts: a model trained on recordings of real arms does not work in a simulated cell with cameras in different places until it is fine-tuned. After fine-tuning on the 100 fixed-condition demonstrations, 11 of 20 (55%). After fine-tuning on the 160 demonstrations that include the miss-and-re-grab ones, 18 of 20 (90%). On the same 20-attempt test, those 160 demonstrations had lowered ACT from 13 of 20 (65%) to 10 of 20 (50%). So the same demonstrations that pulled ACT down pushed SmolVLA up.
CHand-written geometry: no learning at all. Instead of the two colour cameras, C uses a depth camera above the table, which records for every pixel both its colour and its distance from the camera, so the program can convert the image into a list of 3D points on the surfaces it sees. The scene has three blocks of the same size and shape, one red and two in other colours. The program finds and removes the table, a flat plane (the algorithm is RANSAC), splits the remaining points into separate objects (DBSCAN), keeps the red one, and fits the known shape of the block, a 24 mm cube, to those points (ICP) to calculate where the block is and how far it is turned. I wrote all of that maths myself in about 1,030 lines of Python using only NumPy, its numerical library, not a ready-made point-cloud library, and I calibrated the camera's position myself, to within 0.32 mm of its true position. Result: 20 of 20 successful picks in C's own test (a new random layout of the three blocks each attempt), with the block located to within about half a millimetre of its true position. The catch: it only works because I typed the block's exact shape and size into the program, and because the simulated depth camera has no noise. A different object means new code, and a real camera would need noise handling I have not written.
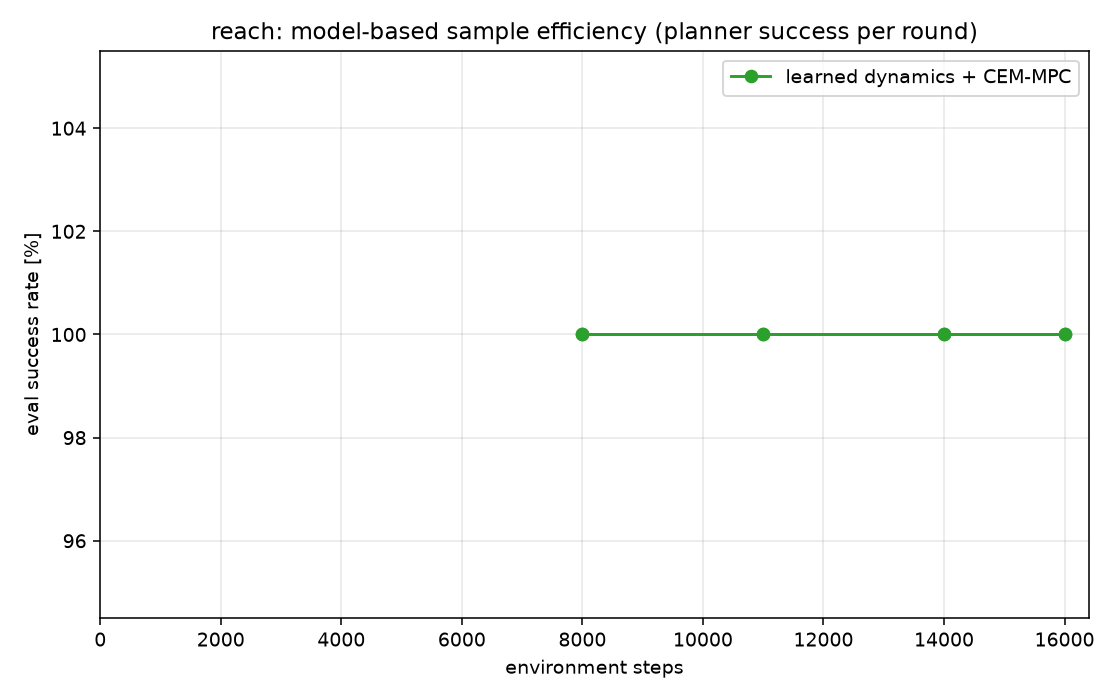
DReinforcement learning: the arm learns from a score, with no demonstrations. Here there are no recordings to copy. The arm starts by moving at random in the simulator, and after every move it receives a score, the reward. A learning algorithm then adjusts the arm's controller (a small neural network that turns the arm's joint readings and the block's position into the next motor command) so that moves which earned higher scores become more likely; repeated over hundreds of thousands of moves, the controller improves. For this part I changed the setup: the controller reads the position of the target or block from the simulator instead of seeing camera images, and it gets two simpler tasks, because the question here is how much practice each method needs. Reach: move the gripper tip to within 2 cm of a target point; the reward was minus the distance from the tip to the target (so the score rises as it gets closer), minus a small penalty for large motor commands, plus 1 for arriving. Lift: grasp the block and hold it more than 7 cm above the table. On reach I compared two standard algorithms, PPO and SAC, against a planner I wrote: three small neural networks learn to predict where the arm's joints will be after a given command, from 8,000 random moves, and before each move a search tests 256 candidate sequences of 15 moves against those predictions, executes the first move of the best sequence, and plans again. My planner (one training run) reached the target in 20 of 20 test attempts after those 8,000 moves. PPO reached 20 of 20 on all three of its runs at its 300,000-move budget (its learning curve levels off around 250,000), and SAC reached 19 or 20 of 20 on each of three runs at its 100,000-move budget (levelling off around 50,000). Lift I gave only to SAC. Its reward went through four versions: version one paid a one-time bonus for lifting past 7 cm and ended the attempt there, so the arm learned to hover the block just below 7 cm and keep collecting the per-move points instead; version two paid for every move above 7 cm with nothing to discourage going higher, so the arm yanked the block as high as it could; version three paid too little for the first few centimetres, so the arm often never lifted at all. The final version pays steeply for the first 7 cm of lift, then 5 points for every move the block is held above 7 cm, minus a penalty above 14 cm, plus small amounts for getting the gripper near the block and closing on it. With it, SAC succeeded in 18, 15 and 11 of 20 attempts (90%, 75%, 55%) across three separate training runs.
EC's final step, rewritten in C++ and run on ROS 2. A real robot runs many separate programs at once (one reading the camera, one driving the motors, one planning routes), and ROS 2 is the messaging system those programs use to pass data to each other. It is the industry standard, and ready-made mapping and navigation programs exist for it. I rewrote the final step of C's block-locating maths, the rotation search and the ICP fit, in C++ (Python is convenient; C++ is faster), including my own 120-line KD-tree, the data structure that makes finding the nearest point among thousands fast, rather than pulling in a large point-cloud library. I wrapped it as a ROS 2 service: another program sends it the block's 3D points and gets back the block's position and rotation. On the same 12 saved sets of block points, the C++ version calculated the same block position as the Python version to within 0.001 mm on every one, in 4.33 ms per set instead of 14.0 ms, 3.3 times faster on average. A production line also has to move parts between cells, so I also ran a simulated wheeled robot (a TurtleBot3) under ROS 2's ready-made mapping and navigation programs: it built a map of a room from its spinning laser range-finder while a small exploration program I wrote drove it around, then drove itself to 6 of 6 target points on that map.
The decision rule
No single winner; it depends on what you have.If the objects are a known shape and size that you can type into the program, as the 24 mm block was, use the hand-written geometry (C): it needs no training data, locates the object to half a millimetre, and when it fails you can see why by looking at the 3D points it was given.If the objects vary but you can cheaply record a few hundred demonstrations that all do the task the same way, use imitation learning (A), and record the demonstrations under randomly varied lighting, colours, block weight and friction, which raised ACT's success from 74% to 90%.If your demonstrations mix ways of doing the task (some grab the block first time, some miss and re-grab), or you might later want to give the arm a different job by changing its text prompt, use the fine-tuned foundation model (B): of the two models trained on mixed demonstrations, it was the one whose success rate went up. (Whether it actually responds to a different prompt is something I have not tested.)If nobody can demonstrate the task at all, reinforcement learning (D) is the fallback; I never gave it the full pick-and-place task, and on the two simpler tasks it fully solved reaching a point but managed grasp-and-lift in only 55% to 90% of attempts depending on the run.Whichever approach you choose, it still has to run on ROS 2 (E) to go into a real robot.For a cell handling parts of a known shape, I would choose C, running as a C++ program under ROS 2.
Try the rule
CHand-written geometry
AImitation learning
BFine-tuned foundation model
DReinforcement learning
EROS 2, whichever you choose
The rule picks C, the hand-written geometry, running on ROS 2 (E).
ACT, the imitation model in A, comes from a 2023 robotics paper (Zhao, Kumar, Levine and Finn). I ran the paper's training method on a much cheaper setup: one arm instead of two, two small cameras instead of four, and a free or laptop GPU. I got 65% to 90% success from 100 to 150 demonstrations, in line with the 86% the paper reports on its own simulated block task. The paper also recommends a technique applied while the trained arm is running, not during training. ACT does not output one motor command at a time: each time it looks at the cameras it outputs a plan of the next 45 commands, and normally it follows the first 15 before looking again and making a new plan. The technique, called temporal ensembling, makes a new plan after every single command and averages the overlapping plans, so each command actually sent is a blend of several recent plans. For the model trained on the fixed-condition demonstrations, this worked as the paper says, raising success from 13 to 15 of 20 (65% to 75%). But for the model trained on the demonstrations that include miss-and-re-grab, a case the paper never tested, the averaging lowered success from 10 to 8 of 20 (50% to 40%), because averaging a plan that says "lift now" with a plan that says "go back and re-grab" produces a movement that does neither. So: switch the averaging off whenever the demonstrations contain more than one way of doing the task, or use a model such as SmolVLA, which coped with them; my explanation, not proven, is that its output layers can hold "lift" and "re-grab" as separate options instead of blending them.
Plan averaging, 20-attempt test
fixed-condition model
13 → 15 of 20 (65% → 75%)
re-grab model
10 → 8 of 20 (50% → 40%)
the paper
+3.3 points on its own tasks
Everything on this page happened in simulation; nothing has run on a physical robot. The success rates for A to D come from my own test runs; the per-attempt logs are not included in the repositories. The C++ speed comparison, the four sets of demonstrations (620 recordings in all) and five of the six trained models (all but the 74% ACT model) are public. Each imitation and foundation model was trained once and tested on 20 to 50 attempts, so I treat a difference of one or two attempts as noise and draw conclusions only from large differences (like 74% to 90%), from results that reverse direction, or from comparing two models attempt by attempt on the same block positions.
01The problem
The robot is the SO-ARM100 described above. I did not build one. I used the simulator model of it published by DeepMind in MuJoCo Menagerie, their collection of accurate simulator models of real robots, so the joints and their ranges of motion match the physical arm, the motor commands are the same six target angles the physical arm's servos take, and the demonstrations are saved in the same LeRobot format used for recordings from the physical arm. Whether anything trained here would work on the real arm is untested; nothing has run on hardware.
The task: a red block, a 24 mm cube, appears at a random spot on the table, and the arm has to pick it up and drop it in a blue tray. In the main comparison (A and B) the model controlling the arm sees only two camera images (a camera in front of the table and a camera on the arm's wrist, each 224 by 224 pixels) and the arm's six joint readings. It is never given the block's position.
Why simulate: MuJoCo is fast enough to run thousands of attempts on a laptop, which is what made a five-way comparison affordable. Recording 620 demonstrations, running hundreds of test attempts, and letting the reinforcement-learning runs practise for up to 500,000 moves cost nothing but computer time.
Why it matters: a work cell has to be re-taught every time the part, the mounting that holds it, or the lighting changes, and how you teach it decides what you pay. On a real cell, a person driving the arm to record demonstrations costs hours (here a script did it, which is why it cost nothing). A pretrained model costs GPU hours (about 8 on a free GPU here). Hand-written geometry costs an engineer's time (about 1,030 lines of maths here). Reinforcement learning costs simulator time (up to 500,000 practice moves here). And moving any of them onto ROS 2 costs integration time, which turned out to be the largest cost of all.
02The experiment
The five approaches are lettered A to E throughout: A imitation learning, B the fine-tuned foundation model, C hand-written geometry, D reinforcement learning, E the move onto ROS 2.
A and B were tested identically: the same simulated arm, block and tray, the same range of possible block starting positions, and the same test. One test attempt puts the block at a position taken from a fixed list of random positions, the same list for every model, none of which appeared in training, and counts as a success if the block ends up in the tray and the gripper pulls away from it within 16 seconds (240 motor commands at 15 per second). Every ACT model ran a 20-attempt test and a 50-attempt test: the 20-attempt test was the original protocol, and the 50-attempt test was added for more reliable headline numbers. SmolVLA ran the 20-attempt test only. Because ACT gives the same output for the same input, two ACT models tested on the same list can be compared attempt by attempt: I can say which starting positions one model failed on and the other did not, not just how many.
C uses the same arm and block but a depth camera above the table in place of the two colour cameras, and a different scene: three blocks of the same size and shape, one red (the target) and two in other colours, with its own 20-attempt test. D changes the question to how much practice a method needs when there is nothing to copy, so it reads the simulator's exact numbers (joint readings and the position of the target or block) instead of camera images and uses two simpler tasks (reach a target point; grasp the block and hold it up), scored on 20 fixed test attempts. E trains nothing: it compares the final step of C's Python code with my C++ rewrite on 12 saved sets of block points, and separately runs a wheeled robot in Gazebo, a second simulator that connects to ROS 2, because a production line also has to move parts between cells.
Hardware: most of the training ran on a free GPU from Kaggle, Google's data-science website, which gives about 30 free GPU hours a week. One ACT model was trained on my laptop's 6 GB GPU, and the SmolVLA tests ran there too. The reinforcement-learning runs used a local GPU for SAC and my planner and a CPU for PPO. ROS 2 ran under WSL2, the Linux virtual machine built into Windows, on the same laptop. Total cloud spend: zero.
Statistics: each ACT and SmolVLA model was trained once; a second training run with a different random seed (the setting that makes a run repeatable) would be an independent check, and I did not run one. With 20 attempts one success is worth 5 percentage points, so 13 of 20 (65%) could plausibly be anywhere from 43% to 82% with more attempts. The claim-by-claim comparison with the ACT paper (linked in section 05) gives that range, a Wilson 95% confidence interval, for every headline number. I treat a difference of one or two attempts as noise, and draw conclusions only from large differences, from results that reverse direction (a gain of 10 points becoming a loss of 10), or from attempt-by-attempt comparisons.
03Five approaches, one cell
Each part answers one question, then says what I tried, what happened, and what went wrong. Technical terms are explained as they appear.
A
PART A · IMITATION LEARNING
Copy 100 to 210 recorded demonstrations (ACT, Action Chunking with Transformers)
Can the arm learn the task by copying recordings of it being done, and what kind of recordings make that work or fail?
Fig. A.1The trained ACT model completing the task from camera images alone (front camera and wrist camera). Open the video.
What I tried
I built the simulated cell first: the MuJoCo scene with the arm, block, tray and two cameras, and an inverse-kinematics solver, the maths that converts "put the gripper at this point, pointing down" into the five arm joint angles that achieve it. Then I wrote the scripted controller that produces the demonstrations. It reads the block's true position from the simulator and moves the gripper through a fixed sequence of positions (above the block, down onto it, close the gripper, lift, over the tray, open, pull away), completing the task in 99 to 100% of recording attempts; failed recordings were discarded. It is the teacher: the model being trained never sees the block's position, only the two camera images and its own six joint readings. Each demonstration (the two camera images, the six joint readings and the motor command, 15 times a second) was saved in the dataset format of LeRobot, Hugging Face's open-source robot-learning library, so that LeRobot's training code could read it and so that it could be published.
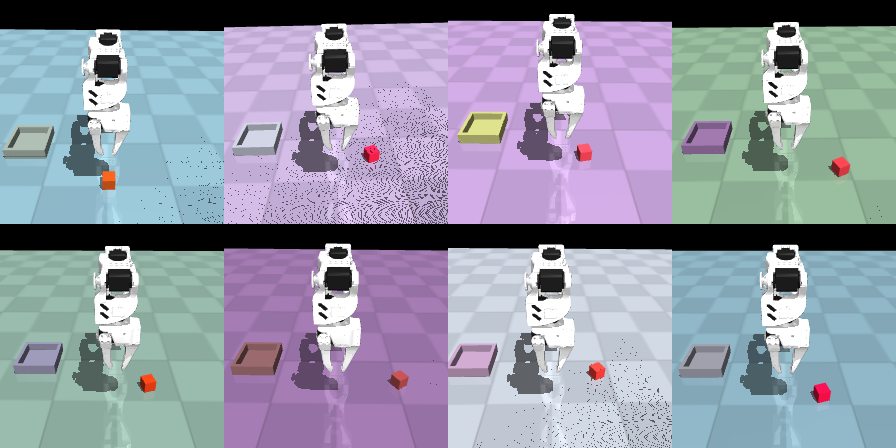
Then I trained ACT, the imitation model introduced in the 2023 paper I compare against in section 05. It takes the two camera images and the six joint readings and outputs the next 45 motor commands as one plan (3 seconds of motion), of which the first 15 are executed before it looks again. I trained it four times, changing only the demonstrations: 100 recorded with the lighting, colours and physics always the same (fixed conditions); 160 recorded the same way except that 20 of them (12.5%) deliberately miss the block by about a centimetre on the first grab and then re-grab it; 150 recorded under randomly varied lighting, scene colours, block weight and friction (this is called domain randomization); and 210 randomized ones, about 30% of them with the block placed in the band of the table nearest the arm, where the 150-demonstration model kept failing. Every model was tested on the same list of block positions, on both the 20-attempt and the 50-attempt test.
Fig. A.2Domain randomization: the 150 demonstrations were recorded under randomly varied lighting, scene colours, block weight and friction.
The four training sets
100
fixed conditions
160
the same, but 20 of them (12.5%) miss the block and re-grab
150
randomized lighting, colours, block weight and friction
210
randomized, about 30% placed nearest the arm
What happened
The demonstrations, not the model, decided the outcome. The model trained on the 100 fixed-condition demonstrations succeeded in 37 of 50 test attempts (74%). The model trained on the 150 randomized demonstrations succeeded in 45 of 50 (90%) on the same fixed-condition test, so training under randomized conditions cost nothing on the unrandomized test; it added 16 percentage points. When I randomized the test conditions too (15 attempts per condition, so those figures are rough), that model scored 13 of 15 with nothing changed, 13 of 15 with the lighting and colours changed, 13 of 15 with the physics changed, and 15 of 15 with both changed. The paper's plan-averaging technique (temporal ensembling: make a new 45-command plan after every single command and average the overlapping plans; section 05) raised the fixed-condition model from 13 to 15 of 20 on the 20-attempt test. In short: one model design, trained four ways, scored anywhere from 62% to 90% depending only on what it was shown.
ACT on the 50-attempt test, by training set
50-attempt test · each model trained once · same list of block positions
Fig. A.3Same list of block positions for every model; the demonstrations, not the model design, moved the score anywhere from 62% to 90%.Table view
Training set
Successes (50-attempt test)
Rate
100 demonstrations, fixed conditions
37 of 50
74%
150 demonstrations, randomized conditions
45 of 50
90%
160 demonstrations, with re-grabs
31 of 50
62%
210 demonstrations, randomized + near the arm
44 of 50
88%
The randomized model under randomized tests
nothing changed
13 of 15
lighting and colours changed
13 of 15
physics changed
13 of 15
both changed
15 of 15
15 attempts per condition, so rough.
What went wrong
Training on the 160 demonstrations that include miss-and-re-grab, which I expected to teach the model to recover from a bad grab, gave 31 of 50 (62%) against the 100-demonstration model's 37 of 50 (74%); on the 20-attempt test the two scored 10 and 13, and switching plan averaging on took the re-grab model from 10 to 8. The reason: at the moment of a grab, the recordings now contain two different correct next moves, lift or go back and retry, and a model that averages what it has seen produces a movement that is neither. The 210-demonstration model fixed the failures near the arm: on a separate probe of 12 grid positions there it succeeded on 12 of 12 where the 150-demonstration model had managed 5 of 12. But on a second 12-position probe at the far side of the table it succeeded on only 4 of 12, failing all 8 positions furthest from the arm, where the 150-demonstration model had managed 12 of 12; and on the 50-attempt test it scored 44 of 50 (88%) against the earlier 45 of 50. The retraining moved the failures instead of removing them. Both of those models (the re-grab one and the 210 one) are published on Hugging Face, labelled as negative results, with a description page saying what went wrong.
Plan averaging: on or off
20-attempt test · plan averaging switched off → on · two ACT models
without plan averagingwith plan averaging
Fig. A.4On the same 20-attempt test, plan averaging lifted the fixed-condition model from 13 to 15 of 20 and lowered the re-grab model from 10 to 8 of 20.Table view
Model (20-attempt test)
Without plan averaging
With plan averaging
Direction
Fixed-condition model
13 of 20 (65%)
15 of 20 (75%)
up, 13 to 15 of 20
Re-grab model
10 of 20 (50%)
8 of 20 (40%)
down, 10 to 8 of 20
Probe grids and the 50-attempt test: where the 210-demonstration model gained and lost
Before → after
150-demonstration model → 210-demonstration model
Near the arm
5 of 12 → 12 of 12 (12 positions)
Far side of the table
12 of 12 → 4 of 12 (12 positions)
8 furthest positions
failed all 8 (210-demonstration model)
50-attempt test
45 of 50 → 44 of 50
90% (45 of 50) with randomized demonstrations+16 points from randomizing the training conditionsRe-grab demonstrations: 74% → 62%; plan averaging then 10 → 8 of 204 datasets (620 demonstrations) + 3 trained models public2 models published as failures, with the reason
Fine-tune a pretrained 450-million-parameter model (SmolVLA)
Does a foundation model for robots, pretrained on other recordings, do the same task after fine-tuning on the same demonstrations, and do the re-grab demonstrations that lowered ACT from 74% to 62% help it?
Fig. B.1The fine-tuned SmolVLA model (the 90% version) doing the same task. Open the video.
What I tried
Instead of training a model from scratch, I started from SmolVLA, a freely downloadable model with 450 million parameters (the adjustable numbers inside a model that training sets; more parameters means a bigger model), published by Hugging Face. Hugging Face pretrained it on a large collection of community recordings, mostly from real SO-100-family arms, the same family as mine. It takes camera images, joint readings and a text prompt (here always "Pick up the red block and place it in the blue tray") and outputs motor commands. A model this size just fits on Kaggle's free 16 GB GPU for fine-tuning. Fine-tuning here meant continuing its training on my demonstrations for 12,000 training steps (each step shows the model one batch of recorded moments and adjusts it slightly), about 8 hours on a free Kaggle GPU (the 20,000 I planned would have exceeded Kaggle's 12-hour session limit), while leaving the parts of the model that read the images and the text unchanged (frozen) and adjusting only the part that turns them into motor commands. I tested it exactly the way I tested ACT: the same 20 block positions, the same 16-second limit, the same definition of success.
The fine-tune
base model
SmolVLA, 450 million parameters
for comparison
ACT, 52 million parameters
training steps
12,000
compute
about 8 hours on a free Kaggle GPU
trained
only the part that turns images and text into motor commands; the image-and-text layers frozen
prompt
"Pick up the red block and place it in the blue tray"
test
the same 20 block positions and 16-second limit as ACT
What happened
The unmodified pretrained model succeeded in 0 of 20 attempts: a model trained on real-robot recordings does not work in a simulated cell with cameras in different places until it is fine-tuned. After fine-tuning on the 100 fixed-condition demonstrations it succeeded in 11 of 20 (55%). After fine-tuning, with identical settings, on the 160 demonstrations that include the miss-and-re-grab ones, it succeeded in 18 of 20 (90%), matching the best ACT model. Those same 160 demonstrations had lowered ACT from 13 to 10 of 20 on this 20-attempt test (37 to 31 on the 50-attempt one), so identical data moved the two models in opposite directions.
SmolVLA on the 20-attempt test
successes out of 20 attempts; one training run per model
Fig. B.2Before fine-tuning, 0 of 20; fine-tuned on the 160 demonstrations that include re-grabs, 18 of 20 (90%), matching the best ACT model.Table view
SmolVLA, 20-attempt test
Successes
Rate
before fine-tuning
0 of 20
0%
fine-tuned on 100 demonstrations
11 of 20
55%
fine-tuned on 160 demonstrations including re-grabs
18 of 20
90%
What went wrong
My explanation is that the part of SmolVLA that generates the motor commands is trained with a method called flow matching, which produces one movement drawn from a range of possibilities, whereas ACT is trained to minimise its average error against the recordings, which pulls it toward the midpoint when two recordings disagree; so SmolVLA can hold "lift" and "re-grab" as two separate options where ACT blends them. That fits the result but is not proven: SmolVLA has 450 million pretrained parameters and ACT has 52 million trained from scratch, so model size and pretraining are alternative explanations I did not rule out. The model accepts a text prompt, but every demonstration used the same sentence, so I have not tested whether it responds to the words at all. Each result is one training run and 20 test attempts, copied by hand from the program's on-screen output rather than from a saved log file. The code in this repository is the fine-tuning notebook and the test script; the simulator, the scripted controller, the demonstrations and the test are reused from Part A.
Why the same data moved them apart (my explanation, not proven)
SmolVLA
flow matching: one movement drawn from a range; 450 million pretrained parameters
ACT
average-error training pulls toward the midpoint; 52 million parameters from scratch
not ruled out
model size and pretraining
not tested
whether it responds to the prompt
Same 160 demonstrations, opposite directions
success on the 20-attempt test; each result is one training run and 20 test attempts
ACT (52 million parameters, trained from scratch)SmolVLA (450 million parameters, pretrained then fine-tuned)
Fig. B.3The 160 demonstrations that pulled ACT down from 13 to 10 of 20 pushed SmolVLA up from 11 to 18 of 20: identical data, opposite directions.Table view
Model, 20-attempt test
Trained on 100 fixed-condition demonstrations
Trained on 160 demonstrations including re-grabs
ACT (52 million parameters, trained from scratch)
13 of 20 · 65%
10 of 20 · 50%
SmolVLA (450 million parameters, pretrained then fine-tuned)
11 of 20 · 55%
18 of 20 · 90%
0% → 55% → 90% (18 of 20)450M parameters, 12,000 fine-tuning stepsOnly the motor-command part of the model trained; one free GPUSame 160 demonstrations moved ACT 65% → 50% on this 20-attempt testResponse to the prompt not yet tested
No learning at all: locate the block with maths (depth camera and hand-written algorithms)
If I already know the block's exact shape, can maths alone beat the trained models, with no training data?
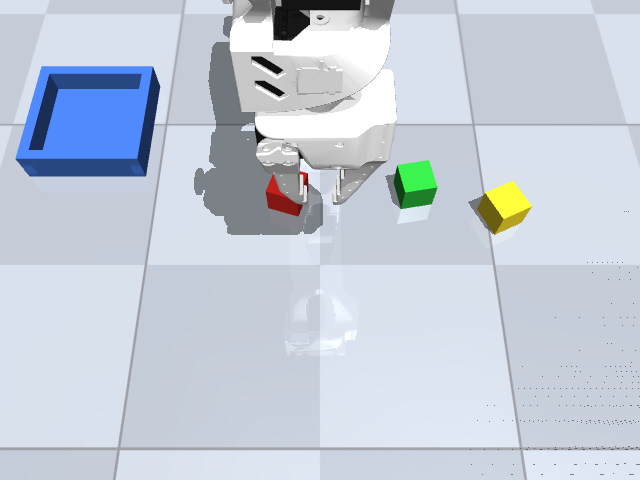
Fig. C.1Depth-camera image in, block position and rotation out: the red block found among two look-alikes and picked into the tray. Open the video.
What I tried
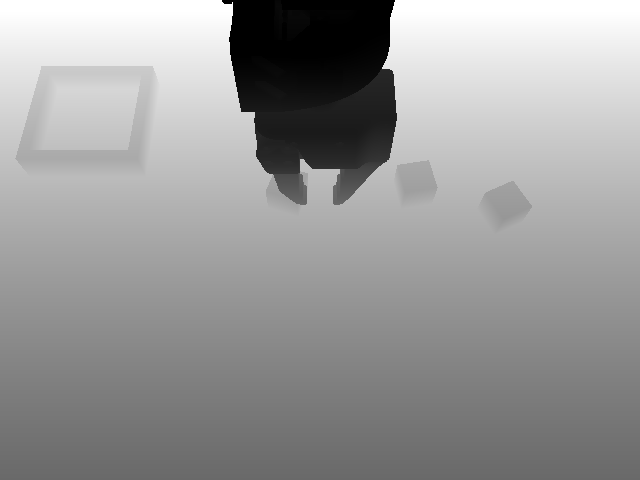
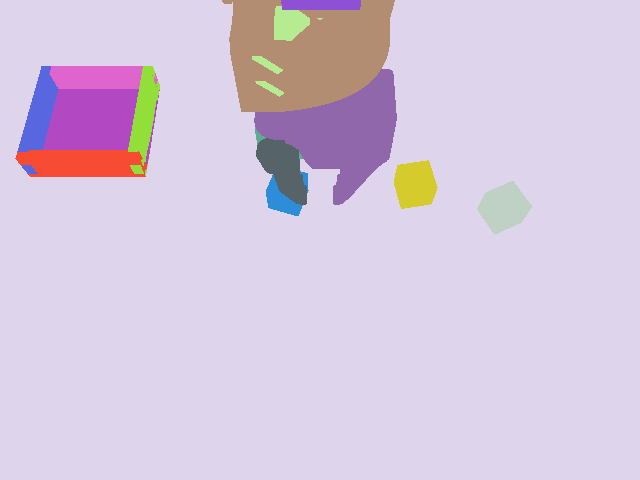
A depth camera above the table records, for every pixel, both its colour and its distance from the camera. Knowing the distance to each pixel lets the program convert the image into a point cloud: a list of 3D points on every surface the camera can see. The scene has three blocks of the same size and shape (24 mm cubes): a red target and green and yellow look-alikes. The program works through four steps, each an algorithm I implemented myself. The conversion from depth image to point cloud is the first. RANSAC then finds the table: it fits a flat plane to small random samples of points, keeps the plane that the most points agree with, and removes those points. DBSCAN splits the remaining points into separate objects: points packed closely together count as one object and a gap starts a new one, so it never needs to be told how many objects there are; the object whose points are red is the target. ICP then fits an ideal 24 mm cube (a set of points on the surface of a perfect cube, not a trained model) to those points: it repeatedly pairs each measured point with the nearest point on the ideal cube and shifts and rotates the cube to fit better, until it stops improving. The result is the block's position and its rotation about the vertical axis (its yaw), which is all the gripper needs, because a cube resting flat on the table can only differ in how far it is turned. The program is also not told where the camera is relative to the arm. I measured that (a camera calibration) by placing a small sphere at 11 known positions in the simulator and solving for the camera position and orientation that best explains where the sphere appeared in each image. All of it is about 1,030 lines of Python using NumPy, the standard array-maths library; the only ready-made routine is SciPy's nearest-neighbour lookup (finding the closest of thousands of points quickly).
colour
depth
segmentation view
fitted outlines
Fig. C.2The depth camera records, for every pixel, its colour and its distance from the camera; the program turns that into a point cloud, finds and removes the table (RANSAC), splits what is left into separate objects (DBSCAN), keeps the red one, and fits an ideal 24 mm cube to its points (ICP) to get the block's position and yaw. The first three panels are the camera's colour, depth and segmentation views; the fourth is the fitted result.
What happened
In the full test (depth image in, block in tray out) the arm picked the red block into the tray in 20 of 20 layouts in which all three blocks were placed at random. The block's position was located to within about half a millimetre: 0.58 mm on average over 15 layouts in Part C's own test, and 0.45 mm on average (worst case 0.77 mm) over the 12 saved sets of block points in the benchmark file in the Part E repository, which runs this exact code. For comparison, simply taking the centre of the block's visible points is off by about 8 mm in my test, because the camera only sees the top and the front faces. The rotation was found to within about 6 degrees on average, and the gripper still closes on the block correctly even when the rotation estimate is up to 20 degrees wrong. The camera calibration recovered the camera's true position to within 0.32 mm and its orientation to within 0.011 degrees; the calibration file that shows this is in the repository. Nothing is trained and no GPU is used. The final step, the rotation search and ICP fit, takes about 14 ms per block on a laptop CPU; the table-finding and clustering steps before it are not timed.
Precision
position
0.58 mm on average over 15 layouts
benchmark
0.45 mm on average, 0.77 mm worst, over the 12 saved sets
for comparison
centre of the visible points: about 8 mm off
rotation
about 6 degrees on average
calibration
camera position to 0.32 mm, orientation to 0.011 degrees
fitting step
about 14 ms per block, CPU only
code
about 1,030 lines of Python
What went wrong
ICP needs a starting guess for the rotation. My first way of choosing it used PCA, a standard method for finding an object's longest axis. A cube seen from above has no longest axis (a square is equally wide in both directions), so the "axis" it found was random noise and ICP kept locking onto a fit 45 degrees off. I replaced it with a brute-force check: try 18 candidate rotations, every 5 degrees across the 90 degrees a cube can differ by, keep the one that fits best, and start ICP from there. Two formulas I derived by hand for how rotating the wrist turns the gripper's jaws each had the sign wrong, so the program now measures which way the jaws point before every grasp, by setting the wrist angle in the arm's model and reading where the jaws end up, instead of trusting a formula. And lowering the gripper straight down onto the block sometimes landed the gripper's fixed jaw (one jaw moves, the other does not) on top of it, because there is only a couple of millimetres of clearance between that jaw and the block, so the gripper now comes in from the side. The limitation of the whole approach: it only works because the block's shape and size are known and the simulated depth camera has no noise. A new object means new code, and a real camera would need noise handling I have not written.
Three fixes
rotation start
ICP from PCA locked 45 degrees off; now 18 candidates every 5 degrees across 90 degrees
jaw direction
two hand-derived formulas had the sign wrong; now read from the simulator before every grasp
jaw clearance
a couple of millimetres, so the gripper comes in from the side
Fig. C.3The clearance failure: coming straight down, the fixed jaw lands on top of the block, so the gripper now comes in from the side.
20 of 20 picks in the full camera-to-tray testBlock located to about 0.5 mmCamera position calibrated to 0.32 mm~1,030 lines of Python, every algorithm hand-writtenNo training, no GPU; ~14 ms for the final fitting step
No demonstrations: the arm learns from a score (reinforcement learning)
With no recordings to copy, how much practice does each learning method need, and can trial and error solve a task that involves grasping?
Fig. D.1The PPO-trained controller moving the gripper tip to target points on the reach task. Open the video.
What I tried
Reinforcement learning works like this: the arm starts by moving at random in the simulator, after every move it receives a score (the reward), and a learning algorithm adjusts the arm's controller (for PPO and SAC, a neural network that picks the next motor command from the joint readings and the position of the target or block) so that the kinds of moves that earned higher scores become more likely. Repeated over many thousands of moves, the controller improves. I set two tasks, both using the simulator's exact numbers (joint readings and block position) as the input rather than camera images. Reach: move the gripper tip to within 2 cm of a target point that changes every attempt (each target is first checked to be reachable). The reward for reach was minus the distance in metres from the gripper tip to the target, so the score rises as the tip gets closer, minus a small penalty for large motor commands, plus 1 for arriving within the 2 cm. Lift: grasp the block and hold it more than 7 cm above the table for the rest of the attempt; its final reward, after four versions (below), pays steeply for the first 7 cm of lift, then 5 points for every move the block is held above 7 cm, minus a penalty above 14 cm, plus small amounts for getting the gripper near the block and closing on it.
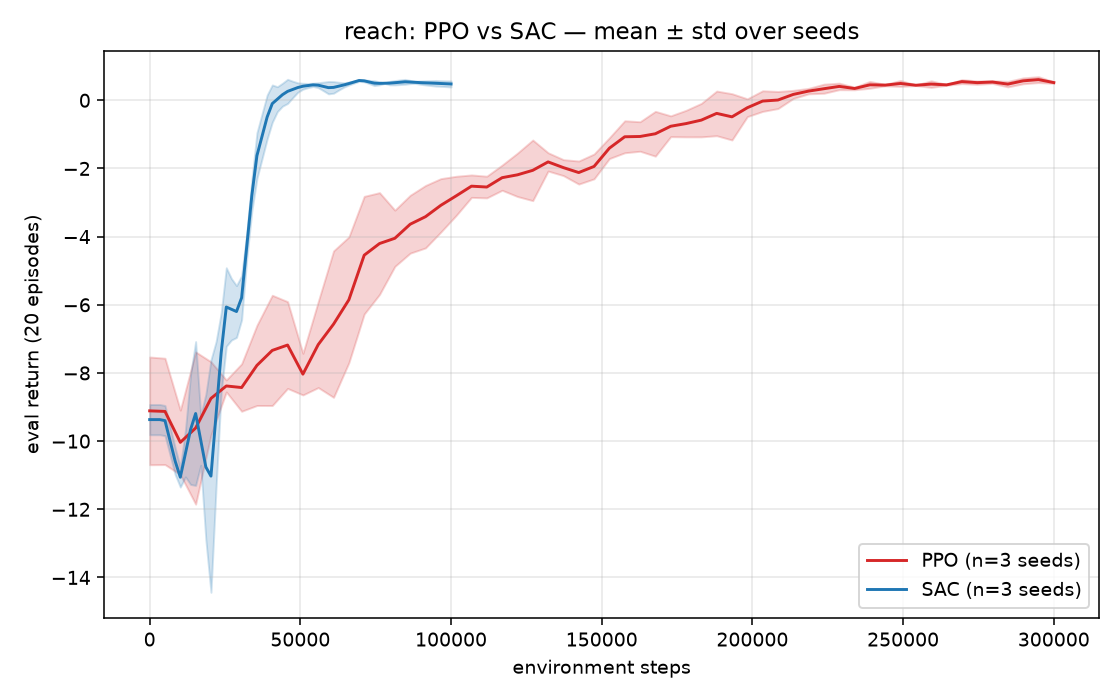
On reach I compared three methods. Two are the standard reinforcement-learning algorithms PPO and SAC, taken from Stable-Baselines3, the well-tested library that implements them (PPO learns only from its most recent moves; SAC stores every move it has ever made and keeps learning from all of them, which usually means it needs fewer moves to learn). The third I wrote myself in about 150 lines of NumPy and PyTorch (the standard neural-network library). First, three small neural networks (their predictions averaged) learn to predict where the arm's joints will be after any given command, from 8,000 random moves. Then, before each real move, a planner generates 256 candidate sequences of 15 moves, scores each sequence with the same reward, using the networks' predictions of where the tip will end up instead of running the simulator, keeps the best 32, generates new candidates around those, repeats four times (this search is the cross-entropy method), and executes only the first move of the winning sequence before planning again. A command simply nudges each servo's target position by a known amount, so I compute that bookkeeping exactly and let the networks learn only how the arm actually moves in response. On lift I used SAC alone.
recorded plot · reward over time
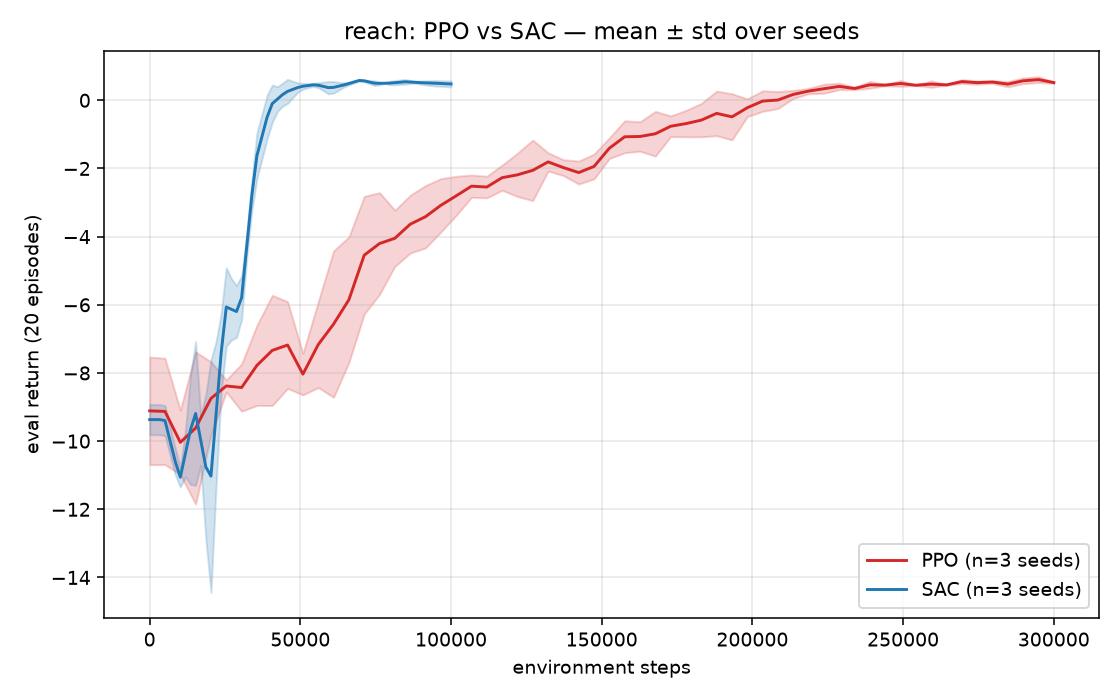
Fig. D.2PPO against SAC on reach, from the repository: SAC levels off around 50,000 moves and PPO around 250,000.
My planner
size
about 150 lines of NumPy and PyTorch
model
three small neural networks, predictions averaged, learned from 8,000 random moves
search
256 candidate sequences of 15 moves, keep the best 32, repeat four times
bookkeeping
each command nudges a servo target by a known amount, computed exactly
What happened
My planner (one training run, against three each for SAC and PPO) reached the target in 20 of 20 test attempts after learning from just those 8,000 random moves, and stayed at 20 of 20 after three further rounds, each round being a few thousand more moves made by the planner itself, added to the training data, with the networks retrained (the plot of success per round is in the repository; the raw evaluation files are not). SAC reached 19 or 20 of 20 on each of three training runs at its 100,000-move budget, and PPO reached 20 of 20 on all three runs at its 300,000-move budget; the reward-over-time curves in the repository show SAC levelling off around 50,000 moves and PPO around 250,000, with PPO still well below its final level at 100,000. On lift, the final reward got SAC to 18, 15 and 11 successes out of 20 (90%, 75%, 55%) across three separate training runs, holding the block around 16 cm up rather than as high as the arm can reach.
SAC on lift, three separate training runs
the final reward version; 20 test attempts per run; runs numbered in the order the text lists them
Fig. D.3The same final reward, three separate training runs, three different results: 18, 15 and 11 of 20, the block held around 16 cm up.Table view
Training run (numbered in the text's order)
Successes
Rate
run one
18 of 20
90%
run two
15 of 20
75%
run three
11 of 20
55%
Reach, by method
my planner
20 of 20 after 8,000 random moves (one run)
SAC
19 or 20 of 20 on each of three runs at its 100,000-move budget (levels off around 50,000)
PPO
20 of 20 on all three runs at its 300,000-move budget (levels off around 250,000)
What went wrong
My first lift results were invalid because of a bug in the code that resets the simulator between attempts: every attempt after the first ended after one move. I caught it because the average attempt length came out at exactly 8.45 moves; attempts are capped at 150 moves, so (150 + 19) / 20 is one full 150-move attempt and nineteen one-move attempts. Then the reward had to be rewritten three times. Version one gave points every move for keeping the gripper close to the block and holding it, plus a one-time bonus for lifting the block past 7 cm, after which the attempt ended; the arm learned to hover the block just below 7 cm for the whole attempt, because collecting the per-move points for 150 moves was worth more than the bonus. Version two gave points for every move with the block above 7 cm, and nothing discouraged going higher, so the arm yanked the block as high as it could reach. Version three made the points rise gradually from table level up to 14 cm, which made the reward for the first few centimetres too small to be worth grasping at all, so the arm often never lifted the block. The final version is the one described above. (The three earlier versions are described from my development notes; their code has been replaced.) Each SAC lift run also spent a long stretch grasping the block without lifting it before suddenly improving, at a different point in each run, so one of the three lift runs needed 500,000 moves to get there where the other two needed 300,000. And the prediction networks in my planner cannot tell when one of their predictions is unreliable, and were used only for reach, never for lift.
The lift reward, four versions
the reward's 7 cm and 14 cm marks; only the kept version's held height is measured, around 16 cm
the version kept (height measured)replaced (no height measured)
Fig. D.4Two loopholes, one reward too weak to make lifting worth it, then the version that works, holding the block around 16 cm up.Table view
Version
What the reward paid
What the arm learned
Where the block went
v1, replaced
per-move points for keeping the gripper close to the block and holding it, plus a one-time bonus for lifting past 7 cm, after which the attempt ended
hovers the block just below 7 cm for the whole attempt: the per-move points for 150 moves were worth more than the bonus
just below 7 cm (not measured)
v2, replaced
points for every move with the block above 7 cm; nothing discouraged going higher
yanks the block as high as it could reach
as high as the arm could reach (not measured)
v3, replaced
points rising gradually from table level up to 14 cm
the reward for the first few centimetres was too small to be worth grasping at all; often never lifted the block
often not lifted (not measured)
v4, kept
steep for the first 7 cm of lift, then 5 points for every move the block is held above 7 cm, minus a penalty above 14 cm, plus small amounts for getting the gripper near the block and closing on it
lifts and holds
around 16 cm (measured)
reset bug
found from an average attempt length of exactly 8.45 moves = (150 + 19) / 20: one full 150-move attempt and nineteen one-move attempts
the three lift runs
runs of 300,000, 300,000 and 500,000 moves
Reach: 20 of 20 after 8,000 practice moves (one run)PPO: 20 of 20 at a 300,000-move budget; SAC: 19 to 20 of 20 at 100,000Lift: 90 / 75 / 55% over three runsReset bug found from an average of exactly 8.45 moves150-line planner, NumPy and PyTorch only
Run the block-locating code on ROS 2 (a C++ rewrite, mapping and navigation)
Can the block-locating code move out of a Python script and run on the software real robots use, and does a C++ rewrite give exactly the same results?
Fig. E.1The simulated TurtleBot3 (a small wheeled robot) driving to target points on the map it built itself; drawn afterwards from the robot's logged positions. Open the video.
What I tried
Parts A to D all ran inside one physics simulator. Real robots run on ROS 2: each part of the robot's software (the camera reader, the motor driver, the route planner, and so on) is a separate program, and ROS 2 is the messaging system they use to send data to each other. It is the industry standard, and ready-made mapping and navigation programs exist for it. I set it up under WSL2 on my laptop. I rewrote the final step of Part C's block-locating code, the rotation search and the ICP fit, in C++ using Eigen, the standard C++ matrix library; the table-finding and clustering steps stayed in Python. I also wrote my own KD-tree (the data structure that makes finding the nearest point among thousands fast) in 120 lines, rather than pulling in a large point-cloud library. The rewrite runs as a ROS 2 service: another program sends it the block's 3D points and gets back the block's position and rotation. To check it, I saved 12 sets of block points produced by Part C's depth camera and clustering steps, along with the true block positions from the simulator, ran both the Python original and the C++ rewrite on all 12, and compared the outputs to the last decimal place.
A production line also has to move parts between cells, so for that I used a simulated TurtleBot3, a small wheeled robot that ships with an official simulation model. A small exploration program I wrote drove it around a simulated room it had no map of for 240 seconds (keep going while the way ahead is clear, turn toward the more open side, with an occasional random turn), while slam_toolbox, a ROS 2 mapping program, built a map from the robot's lidar (a spinning laser that measures the distance to the walls around it). Then Nav2, the ROS 2 navigation program, using AMCL (a program that matches each new lidar scan against the map to work out where the robot is), drove it to six target points: five picked by a script I wrote from the open areas of the map, plus a return to the start.
map being built
finished map
Fig. E.2The map slam_toolbox built from the lidar during the 240-second exploration drive, and the finished map Nav2 then drove on. Open the video.
What happened
For all 12 sets of block points the C++ rewrite produced the same block position as the Python original to within 0.001 mm (the smallest difference the benchmark records: 10 of the 12 were identical to that digit and 2 differed by 0.001 mm), the same rotation, and the same number of ICP iterations. Both versions put the block's centre within 0.45 mm of its true position on average. The C++ version took 4.33 ms per set against Python's 14.0 ms, 3.3 times faster on average (the average of the per-set speed-ups, which ranged from 2.4 to 3.9), on a single CPU core. The navigation run reached all six target points, taking 13 to 49 seconds per point. The benchmark results, the timings of my first slower C++ attempt, and the navigation log are all files in the repository. The demo animations were drawn afterwards from the robot's logged positions and the map, rather than screen-captured, because no screen recorder works with WSL2's graphics.
Milliseconds per set of block points
the rotation search and the ICP fit, milliseconds per set of block points; single CPU core
Fig. E.3Building the KD-tree once instead of every ICP iteration took the C++ rewrite from 9.09 ms to 4.33 ms per set, 3.3 times faster on average than the Python original at 14.0 ms.Table view
Version
Note
ms per set
Python original
SciPy nearest-neighbour
14.0
First C++ version
1.5 to 2 times faster
9.09
C++ with the KD-tree built once
3.3 times faster on average (per set, 2.4 to 3.9)
4.33
Benchmark
Agreement with Python
within 0.001 mm on all 12 sets (10 identical, 2 differ by 0.001 mm)
From the true position
0.45 mm, both versions
ICP iterations
the same number
KD-tree
120 lines, own
Navigation
6 of 6 target points, 13 to 49 s each
Exploration drive
240 seconds
What went wrong
My first working C++ version was only 1.5 to 2 times faster than Python (9.09 ms per set; that timing is also in the repository), because the Python version already uses SciPy's nearest-neighbour search, which is itself written in C. The real speed-up came from a change of approach: build the KD-tree for the ideal cube once and, in each ICP iteration, apply the current shift and rotation to the measured points (so they are expressed in the cube's own coordinates) instead of rebuilding the KD-tree around the moved cube every iteration. Under WSL2, most failures are silent: nothing crashes, no error appears, the robot simply does not move. I wrote up nine of them with dates, each with the symptom, the cause and the fix: for example, a speed command sent in an older message format that the robot's simulation bridge silently ignores, a sender and receiver whose delivery settings did not match so no data ever arrived, and a simulator that froze silently while the mapping program kept re-sending its last map, so every process looked alive. What the benchmark does not show: it checks that the two versions agree on the rotation, but it reports accuracy against the true block position only, not against the true rotation (about 6 degrees in Part C's own test). The KD-tree has no separate correctness tests beyond agreeing with SciPy on those 12 sets; the 4.33 ms is the calculation alone, timed by a standalone benchmark program, and does not include the time to send a request through ROS 2 and get the answer back; and a second navigation run that also reached 6 of 6 was not saved, so this page counts only the recorded one.
Where the speed came from, and what is missing
first C++ version
9.09 ms per set, 1.5 to 2 times faster
KD-tree built once
4.33 ms per set, 3.3 times faster on average
silent failures
9, written up with dates
not benchmarked
rotation error against the truth (about 6 degrees in Part C)
not saved
a second navigation run that also reached 6 of 6
14.0 ms → 4.33 ms per set of block points (3.3× on average), single coreSame position as Python to within 0.001 mm on all 120.45 mm from the true block position, both versions6 of 6 navigation targets in the recorded run9 silent failures documented with dates
Five approaches, what each one cost, and what each one could not do.
Approach
Result
Data needed
Hardware needed
Best when
Cannot
A · Imitation learning (ACT)
90% (45 of 50) with randomized demonstrations; 74% (37 of 50) with fixed-condition demonstrations; 62% (31 of 50) when re-grab demonstrations were included. One training run each.
100 to 210 recorded demonstrations, each about 7.5 seconds long (12 to 26 minutes of simulated arm motion in total), generated by a scripted controller; no human needed to drive the arm
A free Kaggle GPU or a 6 GB laptop GPU to train. The trained model has 52 million parameters, about a ninth the size of SmolVLA, and runs on a laptop fast enough to control the arm live
You can cheaply record a few hundred demonstrations that all do the task the same way
Be taught to recover from a missed grab by adding re-grab demonstrations (that lowered it from 74% to 62%); work without recordings to copy (here, from the scripted controller that reads the block's true position)
B · Fine-tuned SmolVLA
0 of 20 before fine-tuning; 55% (11 of 20) after fine-tuning on 100 demonstrations; 90% (18 of 20) after fine-tuning on 160 including re-grabs. One run, 20 attempts.
The same 100 to 160 demonstrations, plus the pretrained 450-million-parameter model downloaded from Hugging Face
One free Kaggle GPU for about 8 hours per fine-tune, with the image-and-text layers frozen. Nine times more parameters than ACT, so heavier to run (I did not time it)
Your demonstrations show more than one correct way to act, or you may later want to give the arm a different job by changing its prompt (a use I have not tested; see Cannot)
Show that it follows the prompt (every demonstration used the same sentence); be fine-tuned with its image-and-text layers unfrozen (not attempted on the free GPU); run as cheaply as ACT
C · Hand-written geometry
20 of 20 picks in the test; block located to 0.45 to 0.58 mm on average (12 saved sets of block points in the Part E benchmark; Part C's own 15-layout test); camera position calibrated to 0.32 mm
No training data; needs the block's exact shape and size, a flat table, a colour that tells identical shapes apart, and one calibration session with a sphere at 11 positions
CPU only, nothing trained; about 14 ms per block for the final fitting step
The objects are rigid, of known shape, sitting on a flat surface, and you need millimetre accuracy and want to see which step went wrong when it fails
Handle an object whose shape is not programmed in; handle a noisy real camera (it was tuned on noise-free simulated depth images); tell which of a cube's four identical sides is facing front (its rotation is only known to within a quarter turn, which does not matter for a cube but would for a part with a front)
D · Reinforcement learning
Reach: 20 of 20 after 8,000 practice moves with my planner (one run); SAC 19 to 20 of 20 at a 100,000-move budget; PPO 20 of 20 at 300,000. Lift: 90 / 75 / 55% over three SAC runs.
No demonstrations; a simulator and a hand-written reward for each task (the lift reward took four versions)
A local GPU for SAC and my planner, a CPU for PPO; no cloud
Nobody can demonstrate the task but you can write a formula that scores each move (the reward); my planner in particular when practice moves are expensive (it reached 20 of 20 after 8,000 moves; SAC was given 100,000) and the arm's input is a few exact numbers (joint readings and the position of the target or block) rather than camera images
Work from camera images (it needs the block's position as a number); solve the grasping task with my planner (I ran the planner only on reach); say how confident my planner's prediction of the arm's next position is
E · ROS 2
C++ matches Python to 0.001 mm; 14.0 ms → 4.33 ms per set of block points (3.3× on average); 6 of 6 navigation targets in the recorded run, 13 to 49 s each
No learning; 12 saved sets of block points with true block positions for the benchmark; one 240-second exploration drive to build the map
CPU only, under WSL2 (capped at 8 GB of memory) on a 16 GB laptop; the benchmark runs in seconds
The code has to run on a real robot alongside its camera, motor and navigation programs, on the messaging system those programs use
Learn or adapt; run on physical hardware yet (everything ran in simulation); connect the MuJoCo arm to ROS 2 live (the service was tested on saved sets of block points)
The answer
There is no single best way to teach the robot; there is a rule, and each branch of it comes from a number above. Known part shape (here a 24 mm cube): C. No training data, 0.45 to 0.58 mm accuracy, 14 ms per block for the fitting step on a CPU, and when it gets the block wrong you can see which step went wrong (finding the table, separating the objects, or fitting the cube), because every step is ordinary code rather than a trained model. Parts that vary, but a few hundred consistent demonstrations are cheap: A, with the demonstrations recorded under randomly varied lighting, colours, block weight and friction (74% to 90%), and kept to one way of doing the task (adding re-grabs: 74% to 62%). Demonstrations that mix ways of doing the task, or a need to give the cell new jobs later by changing the prompt (whether it actually follows a new prompt is untested here): B, the one of the two demonstration-trained models whose success rate rose on mixed demonstrations (55% to 90%). No demonstrations at all: D, which in my hands solved reaching a point completely and grasp-and-lift only partly (90%, 75% and 55% over three training runs), after four versions of the reward.
Whichever approach wins, it still has to run on ROS 2 (E) next to the robot's other programs, and setting that up cost more time than any algorithm: nine separate silent failures, each written up in the build log. For a factory cell handling parts of a known shape I would choose C, running as the C++ ROS 2 service: it is the cheapest to run (a CPU, 4.33 ms per block for the fitting step), the easiest to check (its answer can be compared with the block's true position, 0.45 mm on average, and the C++ version with the original Python version, to 0.001 mm), and when it fails you can see why by looking at the 3D points it was given, rather than trying to work out what a trained model learned. I would use imitation learning only for parts that cannot be programmed in, and I would record its demonstrations under randomized conditions from day one. The caveat from the five approaches applies to all of it: one task, one arm, simulation only, models trained once.
What I would choose
for parts of a known shape
C, as the C++ ROS 2 service
runs on
a CPU, 4.33 ms per block for the fitting step
checked against the true position
0.45 mm on average
C++ against the Python original
to 0.001 mm
for parts that cannot be programmed in
A, demonstrations randomized from day one
Where the numbers come from. Part E's benchmark and navigation results, Part C's calibration file and Part D's success-per-round plot are files in the repositories that anyone can open and check. The other success rates for A to D come from my own test runs: the datasets, five of the six trained models and every test script are public, but the files recording pass or fail for each of the 20 or 50 attempts are not included in the repositories. Re-checking one of those numbers means re-running the test script on the published model (two of the scripts still contain file paths from my own machine that would need editing), or, for the 74% ACT model, which is not published, retraining it first.
05Against the paper
ACT was introduced in a 2023 paper by Zhao, Kumar, Levine and Finn (published at the Robotics: Science and Systems conference; arXiv 2304.13705), where it controlled two real arms doing precise, small-scale tasks such as sliding open a ziplock bag and putting a battery into a slot. I picked eight claims from the paper; the table below scores each one. Five of them I could test at least in part, and three I could not. The first is simply whether the published training method works when rebuilt from the paper; it does, and the next paragraph lists what I changed. The other four: that outputting a plan of many future commands at once, rather than one command at a time, is the key idea (the paper's own experiment goes from 1% success with one command at a time to 44% with 100-command plans); that averaging overlapping plans while the arm runs (temporal ensembling) adds a small gain of 3.3 points; that about 50 demonstrations and five hours of training on an ordinary GPU are enough; and that demonstrations recorded by humans are harder to learn from than scripted ones (86% with scripted demonstrations against 50% with human ones, on the paper's simulated block task) because humans are inconsistent and do things more than one way, which the paper gave as the reason but never tested by itself.
What I changed: one arm instead of two, two 224-pixel cameras instead of four higher-resolution ones, 15 motor commands per second instead of 50, scripted demonstrations instead of human ones, a smaller model (52 million parameters instead of the paper's 80 million, with 1 layer instead of 7 in the decoder, the part of the model that turns the processed camera images and joint readings into the plan of 45 commands; 1 layer is the default in LeRobot's version of ACT), and a free cloud GPU or a laptop GPU instead of the paper's 11 GB desktop GPU. Even so, the model trained on 100 demonstrations scored 13 of 20 (65%; the true rate could be 43% to 82%) on the 20-attempt test and 37 of 50 (74%; 60% to 84%) on the 50-attempt test, and the model trained on 150 randomized demonstrations scored 45 of 50 (90%; 79% to 96%), in line with the 86% the paper reports on its own simulated block task. So most of those changes did not matter to the method. The averaging technique also behaved as the paper says on the fixed-condition model: 13 to 15 successes out of 20. I could not afford to retrain the model for each plan length (each is a 60,000-step training run of two to four hours), so I changed only how much of each 45-command plan is executed before re-planning: re-planning after every single command, without averaging, collapsed success to 1 of 20 (in all 19 failures the arm stalled in place until the 16-second limit), while executing all 45 commands without looking again gave 13 of 20, the same as the normal setting. That fits the paper's view that plans help by committing the arm to a course of action, not by reacting faster.
Then I tested the one claim the paper stated but did not isolate. Human demonstrations differ from scripted ones in many ways at once; I changed exactly one thing: 12.5% of the demonstrations deliberately miss the block on the first grab and then re-grab it, so from that moment the recordings contain two correct next moves. ACT's success fell from 13 to 10 out of 20, and the averaging technique, which had helped, now hurt (10 to 8 out of 20): averaging a "lift now" plan with a "go back and re-grab" plan gives a movement that does neither. Trained on the identical demonstrations, SmolVLA rose from 11 to 18 out of 20. So the penalty is not a property of the demonstrations alone; it depends on which model is learning from them. Therefore: the paper's advice to average plans is safe only when the demonstrations contain one way of doing the task; switch it off when they contain retries or alternatives, and prefer a model, like SmolVLA, whose output layers keep alternative plans separate. Three of the paper's claims I could not test without human demonstrations or more GPU time: that the CVAE (an extra part of the model used only during training, which summarises each demonstration's particular way of doing the task so the model can learn from inconsistent human recordings) is essential; that ACT beats four older methods; and that human demonstrations must be recorded at 50 commands per second.
Same 160 demonstrations, opposite directions
success on the 20-attempt test; each result is one training run and 20 test attempts
ACT (52 million parameters, trained from scratch)SmolVLA (450 million parameters, pretrained then fine-tuned)
Fig. 5.2The 160 demonstrations that pulled ACT down from 13 to 10 of 20 pushed SmolVLA up from 11 to 18 of 20: identical data, opposite directions.Table view
Model, 20-attempt test
Trained on 100 fixed-condition demonstrations
Trained on 160 demonstrations including re-grabs
ACT (52 million parameters, trained from scratch)
13 of 20 · 65%
10 of 20 · 50%
SmolVLA (450 million parameters, pretrained then fine-tuned)
11 of 20 · 55%
18 of 20 · 90%
The paper says
What I found
Verdict
Outputting a plan of many commands at once is the key idea
Not retrained for different plan lengths. Changing only how much of each 45-command plan is executed: re-planning after every command collapsed success to 1 of 20; executing all 45 without looking stayed at 13 of 20
PARTIALLY TESTED
Averaging overlapping plans adds a small gain (+3.3 points)
+10 points on fixed-condition demonstrations; −10 on demonstrations with re-grabs
REPRODUCED + EXTENDED
The CVAE, a training-only part of the model, is essential for human demonstrations
No human demonstrations and no run without it
NOT TESTED
ACT beats four older methods
Those methods not implemented; compared against SmolVLA on identical data instead
NOT TESTED
About 50 demonstrations and 5 hours on an ordinary GPU are enough
65 to 90% from 100 to 150 scripted demonstrations, two to four hours of training per model on a free or laptop GPU, in simulation only; never tried with as few as 50 demonstrations
PARTIALLY REPRODUCED
Human demonstrations must be recorded at 50 commands per second
No human recording anywhere in the project
NOT TESTED
Human demonstrations, which mix ways of doing the task, are harder to learn from
Tested the mixing by itself: 12.5% scripted re-grab demonstrations stand in for human inconsistency (no human recordings). ACT 65% → 50%, SmolVLA 55% → 90% on the same data
PARTIALLY REPRODUCED + EXTENDED
The published training method works as described
Works, but with a smaller model (52 million parameters, 1 decoder layer instead of 7) and in simulation only, so not the paper's exact setup
PARTIALLY REPRODUCED
Reproduced: I got the paper's result. Extended: I also found where it stops holding. Partially: only part of the claim could be checked (a smaller model, scripted instead of human demonstrations, or one side of the experiment). Tested: checked, but not by repeating the paper's exact experiment.
The full claim-by-claim comparison, with the confidence intervals, the corrections to my own earlier README claims, and the list of what was not tested and why: docs/ACT_REPRODUCTION.md in the Part A repository.
06What I got wrong first
These are the mistakes I caught on the way to the numbers above; each one changed a number that had been wrong.
Part A. My first test under randomized lighting and physics showed every model dropping to 0% as soon as any condition was randomized. The real cause was a bug in the script that runs the tests: it rebuilt the simulator for each condition, and Python then deleted the rendering resource that all those simulators shared, so every camera created afterwards returned black images. I noticed because the randomized model scored 13 of 15 (87%) on the unchanged condition of that same test and "0%" on the very conditions it was trained on, which is impossible; the script now checks that images are not black. The README said the model had about 80 million parameters, a figure copied from the paper; the saved model file holds 52 million. My early tests of plan averaging gave the arm 180 moves per attempt instead of the 240 the other tests allowed; re-running everything at 240 changed the drop that averaging causes on the re-grab model from 15 percentage points to 10 (10 to 8 of 20) without changing its direction. The re-grab model got less training per demonstration than the 100-demonstration model (24 passes over its data against 43), because I trained both for the same number of steps on sets of different sizes; that could account for part of its lower score, and I have not separated it from the effect of the re-grabs themselves. And what the README called "0.1 mm IK accuracy" is a setting, not a measurement: the inverse-kinematics solver from Part A stops refining once it is within 0.1 mm of the target.
Part A, corrected
test-script bug
black camera images; every model 0% until fixed
parameters
README said about 80 million; the saved file holds 52 million
plan-averaging drop
15 points at 180 moves; 10 points at 240
training passes
24 for the re-grab set against 43 for the 100-demonstration set
0.1 mm IK
a solver setting, not a measurement
Part B. A line in the README says 20,000 fine-tuning steps; the notebook, the commit log and the model's configuration file on Hugging Face all say 12,000, which is the correct figure.
Part B, corrected
fine-tuning steps
12,000, not the README’s 20,000
Part C. Starting ICP from PCA gave about 34 degrees of rotation error on average before I replaced it (that version is gone, so the number cannot be re-run). The two formulas I derived by hand for how the wrist's rotation turns the gripper's jaws each had the sign wrong, one in each direction. And when I switched to measuring that relationship in the simulator, measuring it with the jaw open instead of closed gave meaningless numbers that dropped a 21-position grasp test to 4 of 21 until I found the mistake.
Part C, corrected
ICP started from PCA
about 34 degrees of rotation error
jaw measured open, not closed
4 of 21 grasps until fixed
Part D. A reset bug invalidated every early lift run; the arm found loopholes in two versions of the reward, and a third gave it too little incentive to lift at all, before the fourth worked. The repository's README says my planner needs many times fewer practice moves than PPO; that figure is simply one practice-move count divided by the other (300,000 and 8,000), the two budgets I happened to run, not a measurement, so it is not used here.
Part D, corrected
reset bug
every early lift run invalid
reward
two loopholes, one too weak, then the fourth
“many times more sample-efficient”
a budget ratio, not a measurement; not used here
Part E. My first C++ version was only 1.5 to 2 times faster; the README claimed the C++ and Python results agreed to a precision finer than the 0.001 mm the benchmark prints; and the README's navigation tally counted a second run that was never saved, so only the recorded 6 of 6 appears on this page.
Part E, corrected
first C++ version
1.5 to 2 times faster, not 3.3
agreement
0.001 mm, the benchmark’s resolution, not finer
navigation
only the recorded 6 of 6 counts
Across all five repositories, the per-attempt result files for A to D are still not included and none of the repositories has automated tests (code that checks the code still gives the same answers after a change). Those are the next things to fix.
07Open-source fixes, datasets and models
While building Part A on Windows I hit two bugs in LeRobot itself and sent fixes to Hugging Face as pull requests (proposed changes submitted for review). A LeRobot maintainer reviewed one, re-submitted it as their own pull request (#4307, replacing my #4177) with me credited as co-author, and merged it into the library. The bug: LeRobot stores each demonstration's camera images as video and assumed one video-reading library (torchcodec) could be used whenever it was installed; on Windows it usually cannot load, so every attempt to open a dataset crashed. The fix checks whether it loads and otherwise falls back to another library (pyav). Another LeRobot user, not a maintainer, reproduced the same crash on Linux. The second fix (#4174) makes downloading only part of a dataset (selected episodes) work on Windows; it has not been merged yet and is awaiting a maintainer's review. I also tested another contributor's Windows fix (#4121) on a second Windows machine, posted the results and a suggestion as a review comment, and closed my own duplicate fix in favour of theirs.
On Hugging Face I published 4 datasets in LeRobot's format (620 demonstrations, 70,143 camera frames at 15 per second, about 78 minutes of arm motion) and 5 trained models (3 ACT, 2 SmolVLA). Two of the ACT models are the ones that did worse (the re-grab model and the 210-demonstration model), and their description pages say why. The one model not published is the ACT model trained on the 100 fixed-condition demonstrations (the 74% one); it has not been uploaded. The full claim-by-claim comparison with the ACT paper is in the Part A repository, and there is an open request for review of the whole series on GitHub Discussions; as of September 2026 it has no replies, so nothing on this page has been checked by anyone but me. Blunt criticism is welcome there, as a GitHub issue, or by email.